67
Learning Objectives
- Summarize the problems associated with the model of private insurance that characterizes the US health system.
- Explain how and why mistakes and infections occur in hospitals.
- Describe any two other problems in US health care other than the lack of health insurance.
As the continuing debate over health care in the United States reminds us, the practice of medicine raises many important issues about its cost and quality. We now turn to some of these issues.
Private Health Insurance and the Lack of Insurance
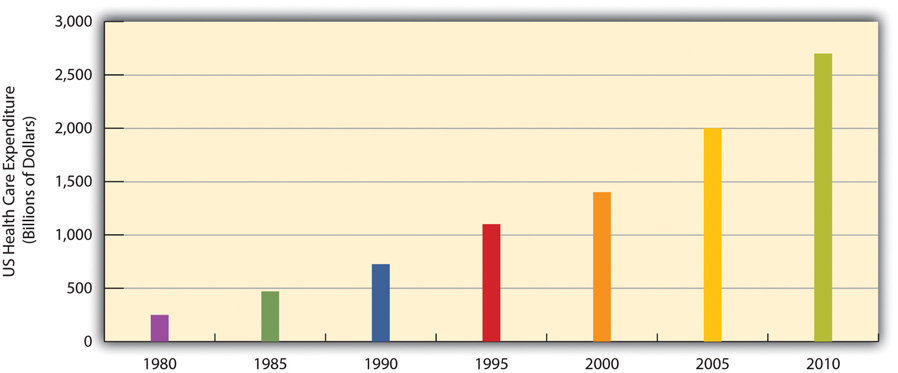
Medicine in the United States is big business. Expenditures for health care, health research, and other health items and services have risen sharply in recent decades, having increased tenfold since 1980, and now costs the nation more than $2.6 trillion annually (see Figure 13.6 “US Health-Care Expenditure, 1980–2010 (in Billions of Dollars)”). This translates to the largest figure per capita in the industrial world. Despite this expenditure, the United States lags behind many other industrial nations in several important health indicators, as we have already seen. Why is this so?
Figure 13.6 US Health-Care Expenditure, 1980–2010 (in Billions of Dollars)
Source: Data from US Census Bureau. (2010). Statistical abstract of the United States: 2010. Washington, DC: US Government Printing Office. Retrieved from http://www.census.gov/compendia/statab.
An important reason is the US system of private health insurance. As discussed earlier, other Western nations have national systems of health care and health insurance. In stark contrast to these nations, the United States relies largely on a direct-fee system, in which patients under 65 (those 65 and older are covered by Medicare) are expected to pay for medical costs themselves, aided by private health insurance, usually through one’s employer. Table 13.4 “Health Insurance Coverage in the United States, 2010” shows the percentages of Americans who have health insurance from different sources or who are not insured at all. (All figures are from the period before the implementation of the major health-care reform package was passed by the federal government in early 2010.) Adding together the top two figures in the table, 54 percent of Americans have private insurance, either through their employers or from their own resources. About 29 percent have some form of public insurance (Medicaid, Medicare, other public), and 16 percent are uninsured. This final percentage amounts to almost 50 million Americans, including 8 million children, who lack health insurance.
Table 13.4 Health Insurance Coverage in the United States, 2010
| Source of coverage | Percentage of people with this coverage |
|---|---|
| Employer | 49% |
| Individual | 5% |
| Medicaid | 16% |
| Medicare | 12% |
| Other public | 1% |
| Uninsured | 16% |
Source: Data from Kaiser Family Foundation. (2012). Kaiser state health facts. Retrieved from http://www.statehealthfacts.org.
Their lack of health insurance has deadly consequences because they are less likely to receive preventive health care and care for various conditions and illnesses. For example, because uninsured Americans are less likely than those with private insurance to receive cancer screenings, they are more likely to be diagnosed with more advanced cancer rather than an earlier stage of cancer (Halpern et al., 2008). It is estimated that 45,000 people die each year because they do not have health insurance (Wilper et al., 2009). The Note 13.22 “Applying Social Research” box discusses a very informative real-life experiment on the difference that health insurance makes for people’s health.
Applying Social Research
Experimental Evidence on the Importance of Health Insurance
As the text discusses, studies show that Americans without health insurance are at greater risk for a variety of illnesses and life-threatening conditions. Although this research evidence is compelling, uninsured Americans may differ from insured Americans in other ways that also put their health at risk. For example, perhaps people who do not buy health insurance may be less concerned about their health and thus less likely to take good care of themselves. Because many studies have not controlled for all such differences, experimental evidence would be more conclusive (see Chapter 1 “Understanding Social Problems”).
For this reason, the results of a fascinating real-life experiment in Oregon were very significant. In 2008, Oregon decided to expand its Medicaid coverage. Because it could not accommodate all the poor Oregonians who were otherwise uninsured, it had them apply for Medicaid by lottery. Researchers then compared the subsequent health of the Oregonians who ended up on Medicaid with that of Oregonians who remained uninsured. Because the two groups resulted from random assignment (the lottery), it is reasonable to conclude that any later differences between them must have stemmed from the presence or absence of Medicaid coverage.
Although this study is ongoing, initial results obtained a year after it began showed that Medicaid coverage had already made quite a difference. Compared to the uninsured “control” group, the newly insured Oregonians rated themselves happier and in better health and reported fewer sick days from work. They were also 50 percent more likely to have seen a primary care doctor in the year since they received coverage, and women were 60 percent more likely to have had a mammogram. In another effect, they were much less likely to report having had to borrow money or not pay other bills because of medical expenses.
A news report summarized these benefits of the new Medicaid coverage: “[The researchers] found that Medicaid’s impact on health, happiness, and general well-being is enormous, and delivered at relatively low cost: Low-income Oregonians whose names were selected by lottery to apply for Medicaid availed themselves of more treatment and preventive care than those who remained excluded from government health insurance. After a year with insurance, the Medicaid lottery winners were happier, healthier, and under less financial strain.”
Because of this study’s experimental design, it “represents the best evidence we’ve got,” according to the news report, of the benefits of health insurance coverage. As researchers continue to study the two groups in the years ahead and begin to collect data on blood pressure, cardiovascular health, and other objective indicators of health, they will add to our knowledge of the effects of health insurance coverage.
Sources: Baicker & Finkelstein, 2011; Fisman, 2011
Although 29 percent of Americans do have public insurance, this percentage and the coverage provided by this insurance do not begin to match the coverage enjoyed by the rest of the industrial world. Although Medicare pays some medical costs for the elderly, we saw in Chapter 6 “Aging and Ageism” that its coverage is hardly adequate, as many people must pay hundreds or even thousands of dollars in premiums, deductibles, coinsurance, and copayments. The other government program, Medicaid, pays some health-care costs for the poor, but many low-income families are not poor enough to receive Medicaid. Eligibility standards for Medicaid vary from one state to another, and a family poor enough in one state to receive Medicaid might not be considered poor enough in another state. The State Children’s Health Insurance Program (SCHIP), begun in 1997 for children from low-income families, has helped somewhat, but it, too, fails to cover many low-income children. Largely for these reasons, about two-thirds of uninsured Americans come from low-income families.
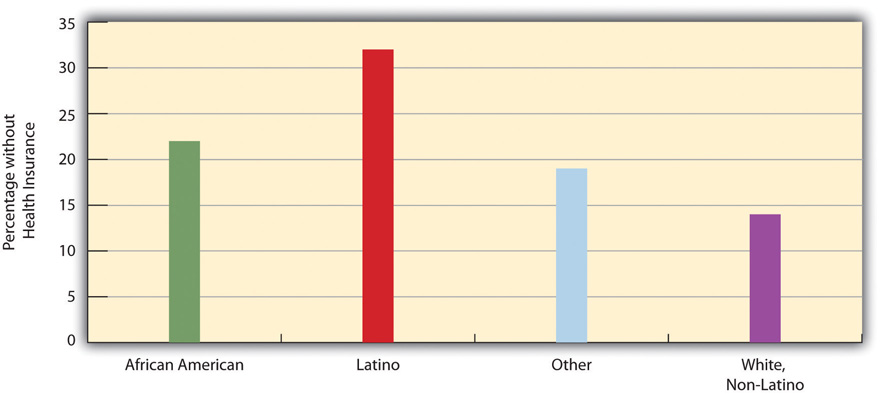
Not surprisingly, the 16 percent uninsured rate varies by race and ethnicity (see Figure 13.7 “Race, Ethnicity, and Lack of Health Insurance, 2008 (Percentage of People under Age 65 with No Insurance)”). Among people under 65 and thus not eligible for Medicare, the uninsured rate rises to almost 22 percent of the African American population and 32 percent of the Latino population. Moreover, 45 percent of adults under 65 who live in official poverty lack health insurance, compared to only 6 percent of higher-income adults (those with incomes higher than four times the poverty level). Almost one-fifth of poor children have no health insurance, compared to only 3 percent of children in higher-income families (Kaiser Family Foundation, 2012). As discussed earlier, the lack of health insurance among the poor and people of color is a significant reason for their poorer health.
Figure 13.7 Race, Ethnicity, and Lack of Health Insurance, 2008 (Percentage of People under Age 65 with No Insurance)
Source: Data from Kaiser Family Foundation. (2012). Kaiser state health facts. Retrieved from http://www.statehealthfacts.org.
The High Cost of Health Care
As noted earlier, the United States spends much more money per capita on health care than any other industrial nation. The US per capita health expenditure was $7,960 in 2009, the latest year for which data were available at the time of this writing. This figure was about 50 percent higher than that for the next two highest-spending countries, Norway and Switzerland; 80 percent higher than Canada’s expenditure; twice as high as Frances’s expenditure; and 2.3 times higher than the United Kingdom’s expenditure (Organisation for Economic Co-operation and Development, 2011). The huge expenditure by the United States might be justified if the quality of health and of health care in this nation outranked that in its peer nations. As we have seen, however, the United States lags behind many of its peer nations in several indicators of health and health care quality. If the United States spends far more than its peer nations on health care yet still lags behind them in many indicators, an inescapable conclusion is that the United States is spending much more than it should be spending.
Why is US spending on health care so high? Although this is a complex issue, two reasons stand out (Boffey, 2012). First, administrative costs for health care in the United States are the highest in the industrial world. Because so much of US health insurance is private, billing and record-keeping tasks are immense, and “hordes of clerks and accountants [are] needed to deal with insurance paperwork,” according to one observer (Boffey, 2012, p. SR12). Billing and other administrative tasks cost about $360 billion annually, or 14 percent of all US health-care costs (Emanuel, 2011). These tasks are unnecessarily cumbersome and fail to take advantage of electronic technologies that would make them much more efficient.
Second, the United States relies on a fee for service model for private insurance. Under this model, physicians, hospitals, and health care professionals and business are relatively free to charge whatever they want for their services. In the other industrial nations, government regulations keep prices lower. This basic difference between the United States and its peer nations helps explain why the cost of health care services in the United States is so much higher than in its peer nations. Simply put, US physicians and hospitals charge much more for their services than do their counterparts in other industrial nations (Klein, 2012). And because physicians are paid for every service they perform, they have an incentive to perform more diagnostic tests and other procedures than necessary. As one economic writer recently said, “The more they do, the more they earn” (Samuelson, 2011).
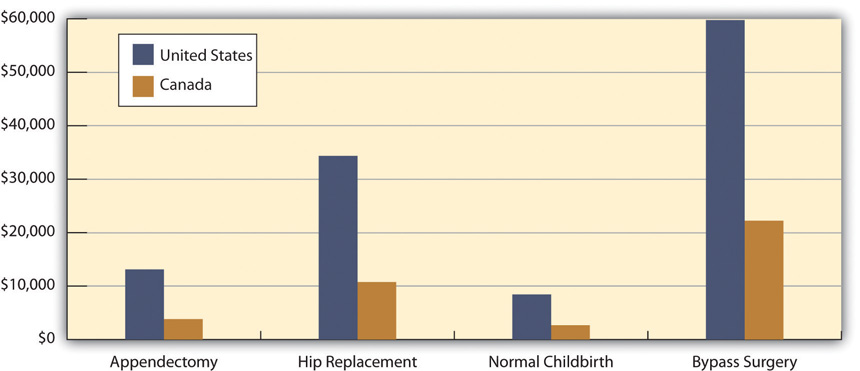
A few examples illustrate the higher cost of medical procedures in the United States compared to other nations. To keep things simple, we will compare the United States with just Canada (see Figure 13.8 “Average Cost of Selected Medical Procedures and Services”). The average US appendectomy costs $13,123, compared to $3,810 in Canada; the average US hip replacement costs $34,354, compared to $10,753 in Canada; the average US normal childbirth costs $8,435, compared to $2,667 in Canada; and the average US bypass surgery costs $59,770, compared to $22,212 in Canada. The costs of diagnostic tests also differ dramatically between the two nations. For example, a head CT scan costs an average of $464 in the United States, compared to only $65 in Canada, and an MRI scan costs and average of $1,009 in the United States, compared to only $304 in Canada (International Federation of Health Plans, 2010).
Managed Care and HMOs
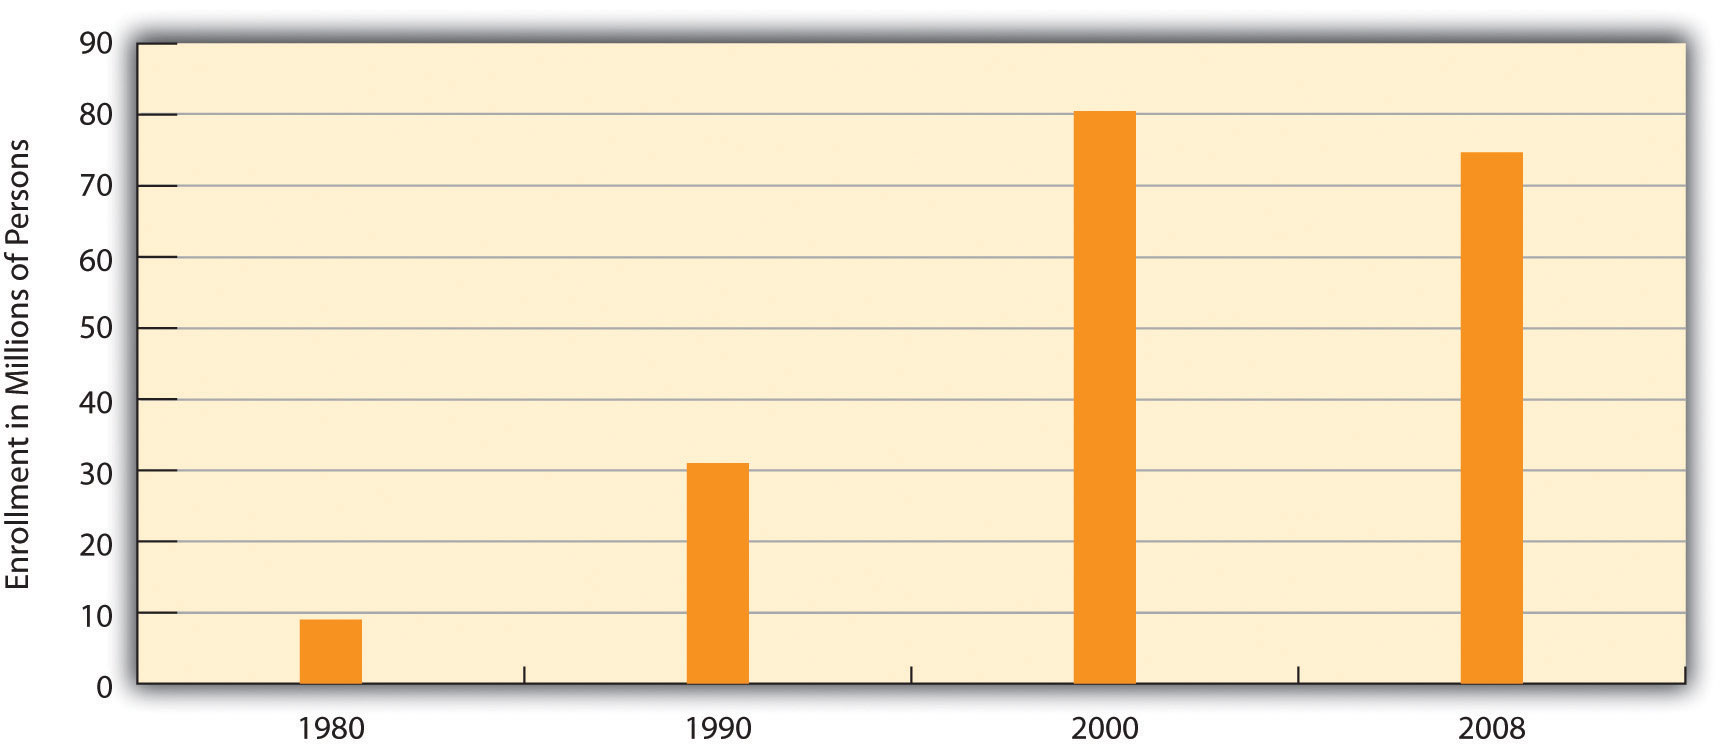
To many critics, a disturbing development in the US health-care system has been the establishment of health maintenance organizations, or HMOs, which typically enroll their subscribers through their workplaces. HMOs are prepaid health plans with designated providers, meaning that patients must visit a physician employed by the HMO or included on the HMO’s approved list of physicians. If their physician is not approved by the HMO, they have to either see an approved physician or see their own without insurance coverage. Popular with employers because they are less expensive than traditional private insurance, HMOs have grown rapidly in the last three decades and now enroll more than 70 million Americans (see Figure 13.9 “Growth of Health Maintenance Organizations (HMOs), 1980–2007 (Millions of Enrollees)”).
Figure 13.9 Growth of Health Maintenance Organizations (HMOs), 1980–2007 (Millions of Enrollees)
Source: Data from US Census Bureau. (2012). Statistical abstract of the United States: 2012. Washington, DC: US Government Printing Office. Retrieved from http://www.census.gov/compendia/statab.
Although HMOs have become popular, their managed care is also very controversial for at least two reasons (Kronick, 2009). The first is the HMOs’ restrictions just noted on the choice of physicians and other health-care providers. Families who have long seen a family physician but whose employer now enrolls them in an HMO sometimes find they have to see another physician or risk going without coverage. In some HMOs, patients have no guarantee that they can see the same physician at every visit. Instead, they see whichever physician is assigned to them at each visit. Critics of HMOs argue that this practice prevents physicians and patients from getting to know each other, reduces patients’ trust in their physician, and may for these reasons impair patient health.

The managed care that HMOs provide is controversial for several reasons. These reasons include restrictions on the choice of physicians and especially on the types of medical exams and procedures that patients may undergo.
Pixabay – CC0 Public Domain.
The second reason for the managed-care controversy is perhaps more important. HMOs often restrict the types of medical exams and procedures patients may undergo, a problem called denial of care, and limit their choice of prescription drugs to those approved by the HMO, even if their physicians think that another, typically more expensive drug would be more effective. HMOs claim that these restrictions are necessary to keep medical costs down and do not harm patients.
Racial and Gender Bias in Health Care
Another problem in the US medical practice is apparent racial and gender bias in health care. Racial bias seems fairly common; as Chapter 3 “Racial and Ethnic Inequality” discussed, African Americans are less likely than whites with the same health problems to receive various medical procedures (Samal, Lipsitz, & Hicks, 2012). Gender bias also appears to affect the quality of health care (Read & Gorman, 2010). Research that examines either actual cases or hypothetical cases posed to physicians finds that women are less likely than men with similar health problems to be recommended for various procedures, medications, and diagnostic tests, including cardiac catheterization, lipid-lowering medication, kidney dialysis or transplant, and knee replacement for osteoarthritis (Borkhoff et al., 2008).
Other Problems in the Quality of Care
Other problems in the quality of medical care also put patients unnecessarily at risk. We examine three of these here:
- Sleep deprivation among health-care professionals. As you might know, many physicians get very little sleep. Studies have found that the performance of surgeons and medical residents who go without sleep is seriously impaired (Institute of Medicine, 2008). One study found that surgeons who go without sleep for twenty-four hours have their performance impaired as much as a drunk driver. Surgeons who stayed awake all night made 20 percent more errors in simulated surgery than those who slept normally and took 14 percent longer to complete the surgery (Wen, 1998).
-
Shortage of physicians and nurses. Another problem is a shortage of physicians and nurses (Mangan, 2011). This is a general problem around the country, but even more of a problem in two different settings. The first such setting is hospital emergency rooms. Because emergency room work is difficult and relatively low paying, many specialist physicians do not volunteer for it. Many emergency rooms thus lack an adequate number of specialists, resulting in potentially inadequate emergency care for many patients.
Rural areas are the second setting in which a shortage of physicians and nurses is a severe problem. As discussed further in Chapter 14 “Urban and Rural Problems”, many rural residents lack convenient access to hospitals, health care professionals, and ambulances and other emergency care. This lack of access contributes to various health problems in rural areas.
-
Mistakes by hospitals. Partly because of sleep deprivation and the shortage of health-care professionals, hundreds of thousands of hospital patients each year suffer from mistakes made by hospital personnel. They receive the wrong diagnosis, are given the wrong drug, have a procedure done on them that was really intended for someone else, or incur a bacterial infection.
An estimated one-third of all hospital patients experience one or more of these mistakes (Moisse, 2011). These and other mistakes are thought to kill almost 200,000 patients per year, or almost 2 million every decade (Crowley & Nalder, 2009). Despite this serious problem, a government report found that hospital employees fail to report more than 80 percent of hospital mistakes, and that most hospitals in which mistakes were reported nonetheless failed to change their policies or practices (Salahi, 2012).
A related problem is the lack of hand washing in hospitals. The failure of physicians, nurses, and other hospital employees to wash their hands regularly is the major source of hospital-based infections. About 5 percent of all hospital patients, or 2 million patients annually, acquire an infection. These infections kill 100,000 people every year and raise the annual cost of health care by $30 billion to $40 billion (Rosenberg, 2011).
Medical Ethics and Medical Fraud
A final set of problems concerns questions of medical ethics and outright medical fraud. Many types of health-care providers, including physicians, dentists, medical equipment companies, and nursing homes, engage in many types of health-care fraud. In a common type of fraud, they sometimes bill Medicare, Medicaid, and private insurance companies for exams or tests that were never done and even make up “ghost patients” who never existed or bill for patients who were dead by the time they were allegedly treated. In just one example, a group of New York physicians billed their state’s Medicaid program for over $1.3 million for 50,000 psychotherapy sessions that never occurred. All types of health-care fraud combined are estimated to cost about $100 billion per year (Kavilanz, 2010).
Other practices are legal but ethically questionable. Sometimes physicians refer their patients for tests to a laboratory that they own or in which they have invested. They are more likely to refer patients for tests when they have a financial interest in the lab to which the patients are sent. This practice, called self-referral, is legal but does raise questions of whether the tests are in the patient’s best interests or instead in the physician’s best interests (Shreibati & Baker, 2011).
In another practice, physicians have asked hundreds of thousands of their patients to take part in drug trials. The physicians may receive more than $1,000 for each patient they sign up, but the patients are not told about these payments. Characterizing these trials, two reporters said that “patients have become commodities, bought and traded by testing companies and physicians” and said that it “injects the interests of a giant industry into the delicate physician-patient relationship, usually without the patient realizing it” (Eichenwald & Kolata, 1999; Galewitz, 2009). These trials raise obvious conflicts of interest for the physicians, who may recommend their patients do something that might not be good for them but would be good for the physicians’ finances.
Key Takeaways
- The US health-care model relies on a direct-fee system and private health insurance. This model has been criticized for contributing to high health-care costs, high rates of uninsured individuals, and high rates of health problems in comparison to the situation in other Western nations.
- Other problems in US health care include the restrictive practices associated with managed care, racial/ethnic and gender bias in health-care delivery, hospital errors, and medical fraud.
For Your Review
- Do you know anyone, including yourself or anyone in your family, who lacks health insurance? If so, do you think the lack of health insurance has contributed to any health problems? Write a brief essay in which you discuss the evidence for your conclusion.
- Critics of managed care say that it overly restricts important tests and procedures that patients need to have, while proponents of managed care say that these restrictions are necessary to keep health-care costs in check. What is your view of managed care?
References
Baicker, K., & Finkelstein, A. (2011). The effects of Medicaid coverage—learning from the Oregon experiment. New England Journal of Medicine, 365(8), 683–685.
Boffey, P. M. (2012, January 22). The money traps in US health care. New York Times, p. SR12.
Borkhoff, C. M., Hawker, G. A., Kreder, H. J., Glazier, R. H., Mahomed, N. N., & Wright, J. G. (2008). The effect of patients’ sex on physicians’ recommendations for total knee arthroplasty. Canadian Medical Association Journal, 178(6), 681–687.
Crowley, C. F., & Nalder, E. (2009, August 9). Secrecy shields medical mishaps from public view. San Francisco Chronicle, p. A1.
Eichenwald, K., & Kolata, G. (1999, May 16). Drug trials hide conflicts for doctors. New York Times, p. A1.
Emanuel, E. J. (2011, November 12). Billions wasted on billing. New York Times. Retrieved from http://opinionator.blogs.nytimes.com/2011/2011/2012/billions-wasted-on-billing/?ref=opinion.
Fisman, R. (2011, July 7). Does health coverage make people healthier? Slate.com. Retrieved from http://www.slate.com/articles/business/the_dismal_science/2011/07/does_health_coverage_make_people_healthier.html.
Galewitz, P. (2009, February 22). Cutting-edge option: Doctors paid by drugmakers, but say trials not about money. Palm Beach Post. Retrieved from http://www.mdmediaconnection.com/printmedia.php#!prettyPhoto[iframe2]/0/.
Halpern, M. T., Ward, E. M., Pavluck, A. L., Schrag, N. M., Bian, J., & Chen, A. Y. (2008). Association of insurance status and ethnicity with cancer stage at diagnosis for 12 cancer sites: A retrospective analysis. The Lancet Oncology, 9(3), 221–231.
Institute of Medicine. (2008). Resident duty hours: Enhancing sleep, supervision, and safety. Washington, DC: National Academies Press.
International Federation of Health Plans. (2010). 2010 comparative price report: Medical and hospital fees by country. London, United Kingdom: Author.
Kaiser Family Foundation. (2012). State health facts. Retrieved from http://www.statehealthfacts.org.
Kavilanz, P. (2010, January 13). Health care: A “gold mine” for fraudsters. CNN Money. Retrieved from http://money.cnn.com/2010/01/13/news/economy/health_care_fraud.
Klein, E. (2012, March 2). High health-care costs: It’s all in the pricing. The Washington Post. Retrieved from http://www.washingtonpost.com/business/high-health-care-costs-its-all-in-the-pricing/2012/02/28/gIQAtbhimR_story.html.
Kronick, R. (2009). Medicare and HMOs—The Search for Accountability. New England Journal of Medicine, 360, 2048–2050.
Mangan, K. (2011). Proposals to cut federal deficit would worsen physician shortage, medical groups warn. Chronicle of Higher Education, 58(6), A17–A17.
Moisse, K. (2011, April 7). Hospital errors common and underreported. ABCnews.com. Retrieved from http://abcnews.go.com/Health/hospital-errors-common-underreported-study/story?id=13310733#.TxxeY13310732NSRye.
Organisation for Economic Co-operation and Development. (2011). Health at a glance 2011: OECD indicators. Paris, France: Author.
Read, J. G., & Gorman, B. M. (2010). Gender and health inequality. Annual Review of Sociology, 36, 371–386.
Rosenberg, T. (2011, April 25). Better hand-washing through technology. New York Times. Retrived from http://opinionator.blogs.nytimes.com/2011/2004/2025/better-hand-washing-through-technology.
Salahi, L. (2012, January 6). Report: Hospital errors often unreported. ABCnews.com. Retrieved from http://abcnews.go.com/Health/Wellness/hospital-staff-report-hospital-errors/story?id=15308019#.TxxfKWNSRyd.
Samal, L., Lipsitz, S. R., & Hicks, L. S. (2012). Impact of electronic health records on racial and ethnic disparities in blood pressure control at US primary care visits. Archives of Internal Medicine, 172(1), 75–76.
Samuelson, R. J. (2011, November 28). A grim diagnosis for our ailing health care system. The Washington Post. Retrieved from http://www.washingtonpost.com/opinions/a-grim-diagnosis-for-our-ailing-us-health-care-system/2011/11/25/gIQARdgm2N_story.html.
Shreibati, J. B., & Baker, L. C. (2011). The relationship between low back magnetic resonance imaging, surgery, and spending: Impact of physician self-referral status. Health Services Research, 46(5), 1362–1381.
Wen, P. (1998, February 9). Tired surgeons perform as if drunk, study says. The Boston Globe, p. A9.
Wilper, A. P., Woolhandler, S., Lasser, K. E., McCormick, D., Bor, D. H., & Himmelstein, D. U. (2009). Health insurance and mortality in US adults. American Journal of Public Health, 99(12), 1–7.


